This article is more than
9 year oldAfter years of watching their incomes go nowhere, America's middle class finally got a big raise last year.
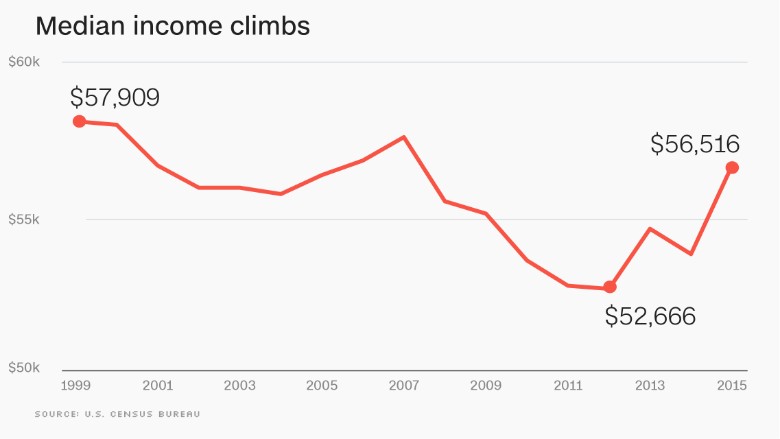
Median household income rose to $56,516 in 2015, up 5.2% from a year earlier, according to data released by the U.S. Census Bureau Tuesday. It marks the first increase in median income since 2007, the year before the Great Recession started.
Also, the poverty rate ticked down to 13.5% in 2015, from 14.8% a year earlier.
The data is sure to become a talking point in the 2016 presidential election. Donald Trump has repeatedly hammered home that income is $4,000 lower than it was in 2000. (That's true if you are comparing it to 2014 data, which had been the most recent available. But Trump often referenced it as current figures, which makes it false.)
Hillary Clinton, meanwhile, will likely use the uptick to show that the economy is recovering.
Median income: The jump in median income was one of the largest annual increases Census has recorded. The growth was also widespread, with geographic regions and races (except for Asians) seeing increases.
Related: Trump's economic speech: CNN's Reality Check Team vets the claims
Behind the pay hike is the big increase in employment, Census officials said. Some 3.3 million more Americans were working full-time, year-round, pushing up median income. Some 1.4 million more men and 1 million more women had jobs last year.

Still, income remains 1.6% lower than it was in 2000, when it hit $57,790, and 2.4% below the 1999 peak at $57,909.
Income inequality, however, remained at the same level as 2014. It has increased 5.5% since 1993.
Poverty: The poverty rate is the lowest it's been since 2008, when it was 13.2%. Some 43.1 million Americans were in poverty last year, 3.5 million less than in 2014.
The poverty rate dropped for children, adults and senior citizens.
The poverty threshold for two adults and two children was just over $24,000 last year.

Trump also references the poverty rate to show that Americans have suffered under President Obama. The rate was at 12.5% in 2007, before the Great Recession hit. It jumped to 15.1% in 2010 and has slowly drifted downward since.
The Census Bureau also released an alternate poverty measure that takes into account various government benefits and expenses not captured by the official poverty rate. The so-called Supplemental Poverty Measure showed 14.3% of Americans were in poverty in 2015, compared to 15.3% a year earlier.
The supplemental measure showed that non-cash public assistance, such as food stamps, housing vouchers and refundable tax credits, helped lift many Americans out of poverty. However, it also takes into account work-related costs such as transportation and child care, as well as medical and tax expenses, which all together drove more people into poverty.
Health insurance: The uninsured rate fell to 9.1% in 2015, according to the Census Bureau. That's down from 10.4% the year before, when the Obamacare exchanges and Medicaid expansion began. Some 29 million were without insurance last year, compared to 33 million in 2014.
The uninsured rate has dropped as millions of Americans gained coverage under Obamacare.
More recent government data found that the uninsured rate fell to 8.6% in the first quarter of this year. Some 27.3 million people lacked health coverage, according to the National Health Interview Survey, published by the Centers for Disease Control and Prevention.